Crime stats or coffee shops? How to spot the world’s most gentrified cities
Researchers worldwide have come up with many innovative ways to make sense of gentrification and perhaps even prevent its worst effects. Douglas Murphy crunches the numbers
Gentrification is a word on many lips. Property values, rent rises, people displacement, speculative development, offshore investment; coffee shops, beards, bikes and vanishing nightlife. In the worlds big cities, gentrification and its discontents have become a cause clbre.
But as that range of complex ideas suggests, gentrification is also a notoriously slippery concept. Is it a purely economic process, or is it culturally driven? Is every deprived neighbourhood that experiences an influx of wealthy residents an instance of gentrification? Must the change occur organically, or can governments gentrify areas according to a plan?
In the half-century since Ruth Glass first employed the term to describe the return of the London middle classes to Victorian properties previously subdivided into slums sociologists, geographers, economists and anthropologists have all struggled to agree on a coherent and transferable definition of the politically loaded G-word.
In recent years, however, increasing amounts of data and the ability to overlay divergent phenomena has led to studies that try to make sense of what is sometimes described as a phantom concept. By understanding and measuring the process, some believe it may be possible to alleviate the most damaging effects of gentrification: the impoverishment and displacement that frequently accompany it.
The most fundamental evidence for gentrification comes from the cost of property. Rapid increases in the cost of buying or renting a house, above rises in income, are clear signs of a rapid change in the urban character of a neighbourhood.
Last year, NYUs Furman Center prepared a report on New York City, source of much of the rhetoric around gentrification, that charted changes in rental value from 1990-2010.
While rents increased generally over this 20-year period, various neighbourhoods, such as the infamous Williamsburg spiritual home of the hipster saw increases as much as 50% higher than those of the city as a whole. These changes corresponded to generally perceived changes in demographics and social class.
The Voorhees Center at the University of Illinois called its study of Chicago over 40 years a gentrification index. Taking information from the US Census from 1970 to 2010, it attempted to measure the local changes in a wider set of variables such as education, poverty, private school attendance or family income against the city average. The goal, again, was to understand which neighbourhoods could be said to have gentrified.
The results, too, tallied with anecdotal evidence. Chicagos central lakeside areas, which had seen postwar decline with American suburbanisation, have become highly desirable again; they have significantly gentrified. But the data also shows that these upwardly mobile neighbourhoods are surrounded by many suburbs that have declined severely over the same time.
While census data is rich and comprehensive, there are concerns that the relatively sporadic collection of information just doesnt have the fine resolution required to identify gentrification in some of its wilder forms, where neighbourhoods are transformed within a matter of years. If the phenomenon is to be spotted in time to help those who suffer from it, we need to be better at predicting it.
In these cases, the challenge is to identify the preconditions for gentrification. The classic analysis is to find the rent gap, as developed by geographer Neil Smith: a period of decline in which the potential value of land and property in an area is much higher than what is currently being charged. This is a necessary condition for gentrification, but can be a blunt measurement, and applies to many areas that are nowhere near actually gentrifying.
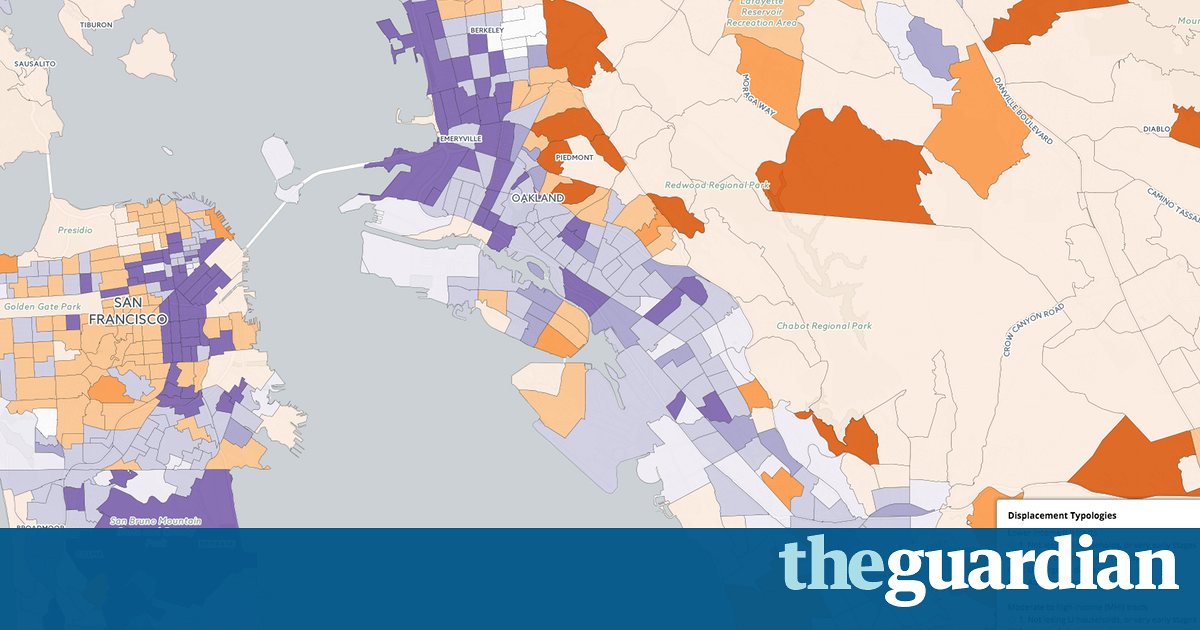
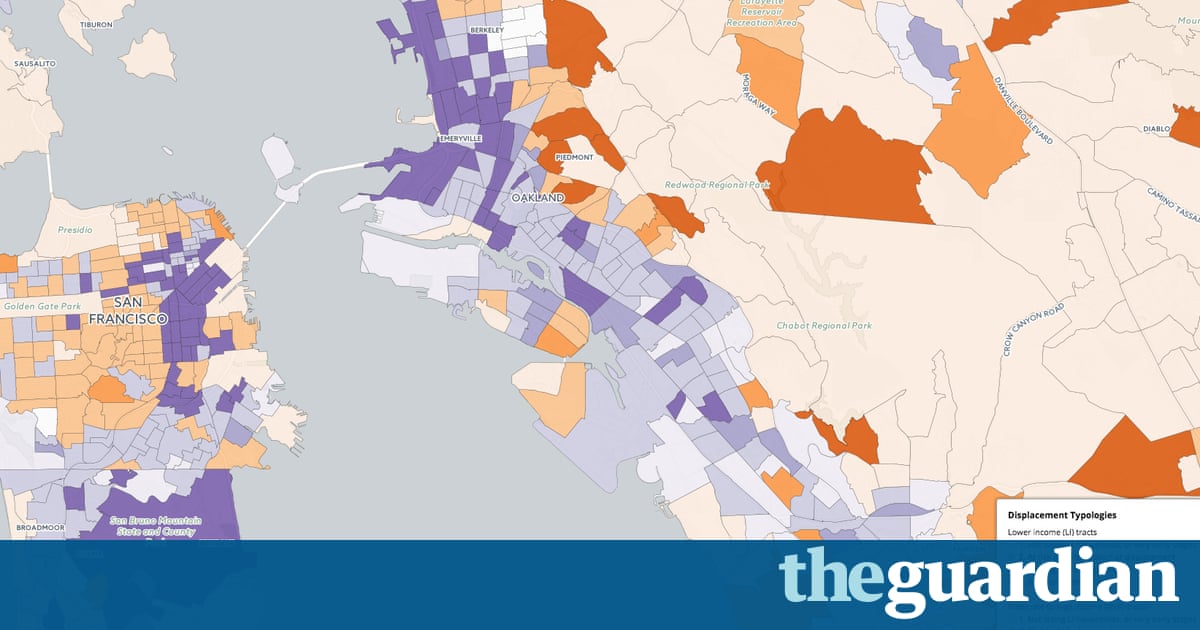
Instead, researchers look for other clues. A recent study of Boston identified a number of factors, including proximity to public transport and locations of subsidised housing projects, to create a gentrification vulnerability index. Similarly, researchers from Berkeley and UCLA working on the Urban Displacement Project take into account a huge variety of data, including transport connections, education levels, population density, types and tenure of housing, all to create interactive maps of LA and the San Francisco Bay Area that give easily digestible information on changed neighbourhoods and the possibilities of change in the future.
Dynamically overlaying statistical information on to maps is becoming popular, too. Partly, this is due to the increasing availability of data. But its also due to the strength of its communicative power. For example, the recent deprivation maps of England and Scotland, or work by the Joseph Rowntree Foundation,starkly mark out the proximity of rich and poor in our cities.
Some studies aim to be tools for residents to stay one step ahead. Activists in Bushwick, one of Brooklyns rapidly changing neighbourhoods, have created an interactive mapping resource that looks to track the urban vices of gentrification and displacement. Here, the graphic display of data is deliberately aimed at activists and community members who stand to lose the most.
Data graphics can even be a polemic. When the Heygate, a 1970s council estate in London, was controversially demolished to make way for new and mostly private developments, the campaign group Heygate Was Home used freedom of information requests to graphically map out the displacement of the original residents not just out of central London but across the country. This decanting map has become a famous symbol of the pain of gentrification.
One of the problems with measuring gentrification, of course, is that not every variable always appears in the same way. For example, the particular character of American inequality means that race is frequently considered to be a major factor. The late 20th century saw the white middle classes largely abandoning the inner cities, and an increase of white residents is now taken to be a sure sign of gentrification. But this metric cant apply in less politically segregated contexts.
Whats more, the evidence of whether victims of gentrification are primarily displaced or simply further impoverished is mixed. And data on various social factors such as access to public education is only relevant if it applies to the local political context. These ambiguities encourage the creation of alternative strategies for mapping gentrification, utilising disparate data, or even public sentiment itself: the I know it when I see it factor.
For example, a Dutch communications firm has conducted crowdsourced research on Amsterdam, Brooklyn and Toronto, asking where people believed gentrification was occurring, without recourse to data. The public were asked to draw front lines of gentrification on the map, as if the process were a battle between old and new. This may be methodologically flimsy, but it does highlight the fact that perceptions of various areas are part of what makes up our understanding of gentrification.
One infamous metric is the coffee shop. Academics have looked at correlations between the prevalence of coffee shops against deprivation and crime, noting that more coffee shops coincided with less crime highly suggestive of gentrification. This concept can surface in unpleasant ways, such as one study in London that mapped the presence of coffee shops against fried chicken shops, looking for cheap areas that showed signs of being legitimately up and coming.
Other innovations came from Cambridge academics, who compared data on deprivation against the use of social media. Here, the signs of impending gentrification are taken to be social deprivation in combination with a high degree of social diversity as exemplified by the top scoring of Hackney, one of the areas of London with most rapidly increasing house prices and demographic shifts.
Even more clever is a study of Chicago that included images from Google Street View to exclude non-gentrifying forms of value-increase. The rationale was that the visible streetscape of neighbourhoods provides direct indicators of change: in other words, examining visual evidence allows us to better judge precisely what kind of urban change is occurring in each area.
Taken together, what the wide variety of research shows is that a single, universal measurement of gentrification is probably impossible, with all the fraught political and cultural considerations at work.
Nonetheless, what all studies take as their basis is the affordability of, and access, to housing. The fundamental force of gentrification is a rapid upward change in these costs. Across the world, the highest rises in residential property value are dominated by US, European and Australasian cities. San Francisco and London both near the top, with annual rises of more than 10%.
Even so, its not enough: while Shenzhen has seen a staggering rise in housing costs (nearly 50%), it would be hard to say that this brand-new megacity was gentrifying; whereas its neighbour Hong Kong, whose housing supply is extremely limited, is currently experiencing a serious struggle.
Istanbul, with a rise last year of 25%, is one of the starkest examples. In 2013, the proposed redevelopment of a public space into a shopping mall sparked the Gezi Park protests and a campaign familiar to anti-gentrification activists worldwide took on a whole new dimension, demonstrating just how embedded the issue is with all other political struggles. Above all, its this fact that gentrification so often opens the floodgates to more cataclysmic urban change that shows just how important it is that it can be identified and measured.
Are you experiencing or resisting gentrification in your city? Share your stories in the comments below, through our dedicated callout, or on Twitter using #GlobalGentrification